Detecting Brute Force Attacks with Splunk
Brute force attacks aren't just random password guesses. They are high-volume authentication failures that leave a clear trail in system logs. In this project, I built a Splunk detection workflow to identify brute force activity, create automated alerts, and visualise the results in a dashboard.
This was my first hands-on Splunk project, and here's how I did it step by step:
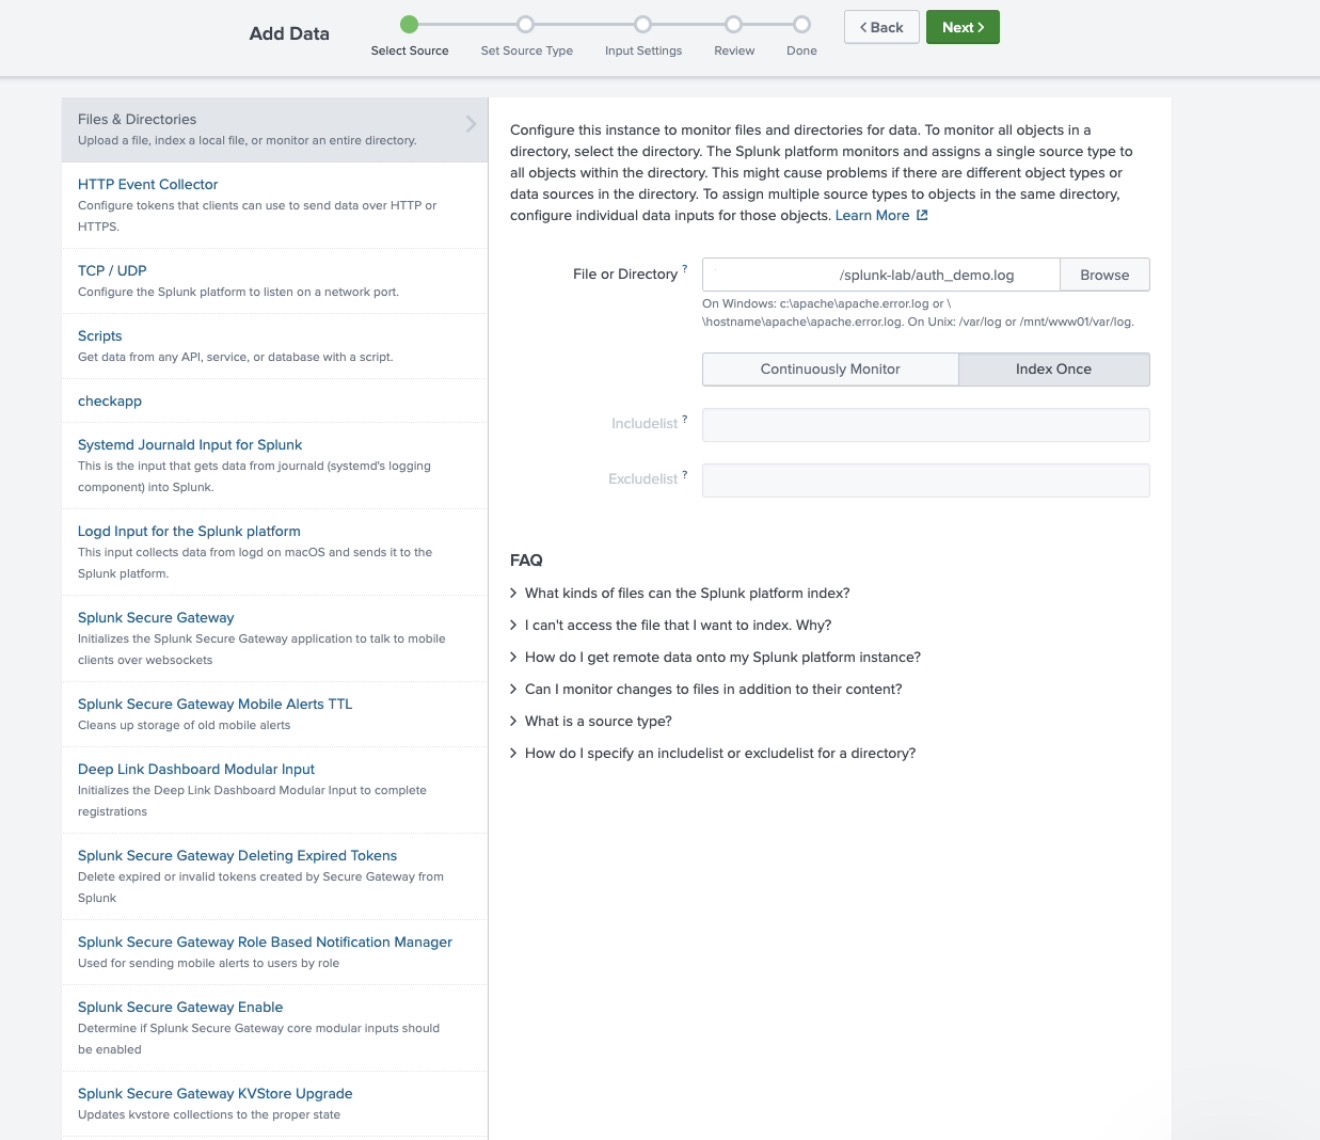
1: Ingest Authentication Logs
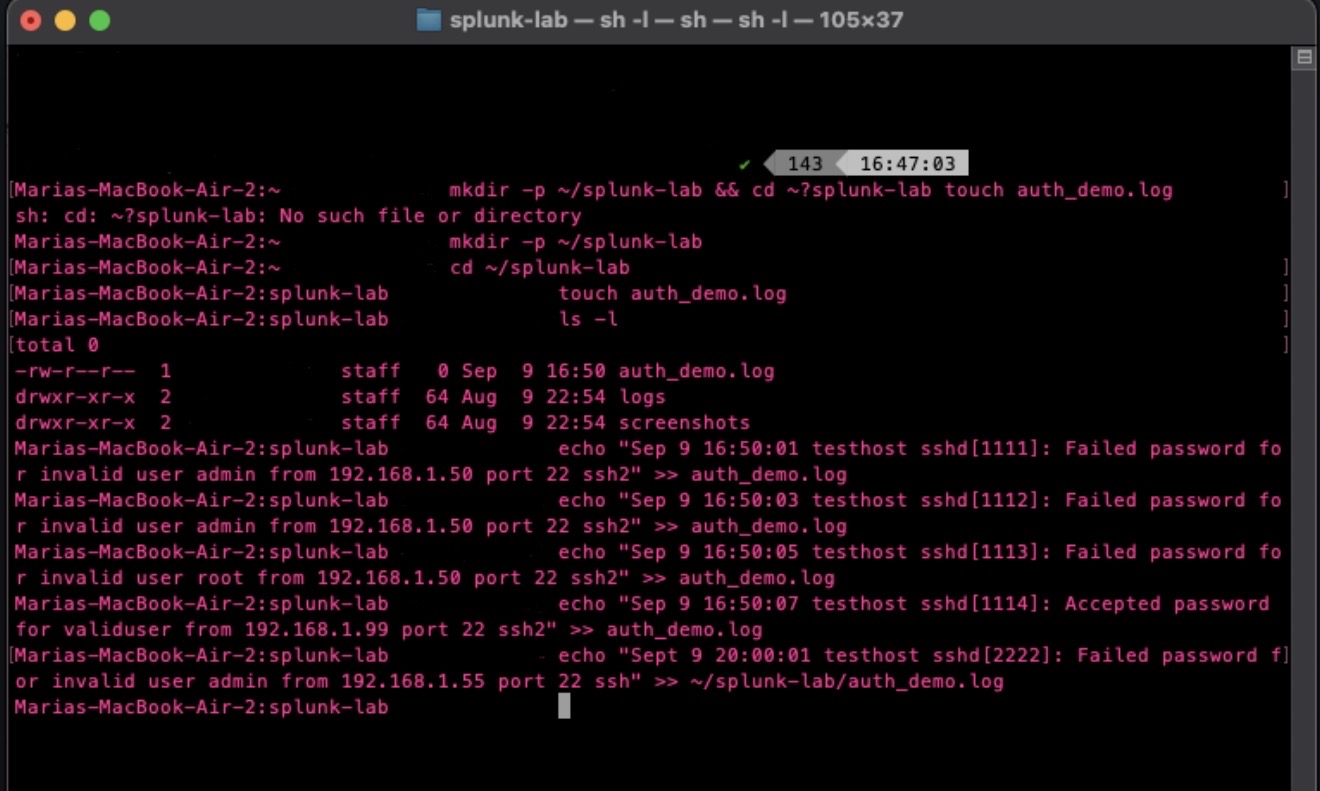
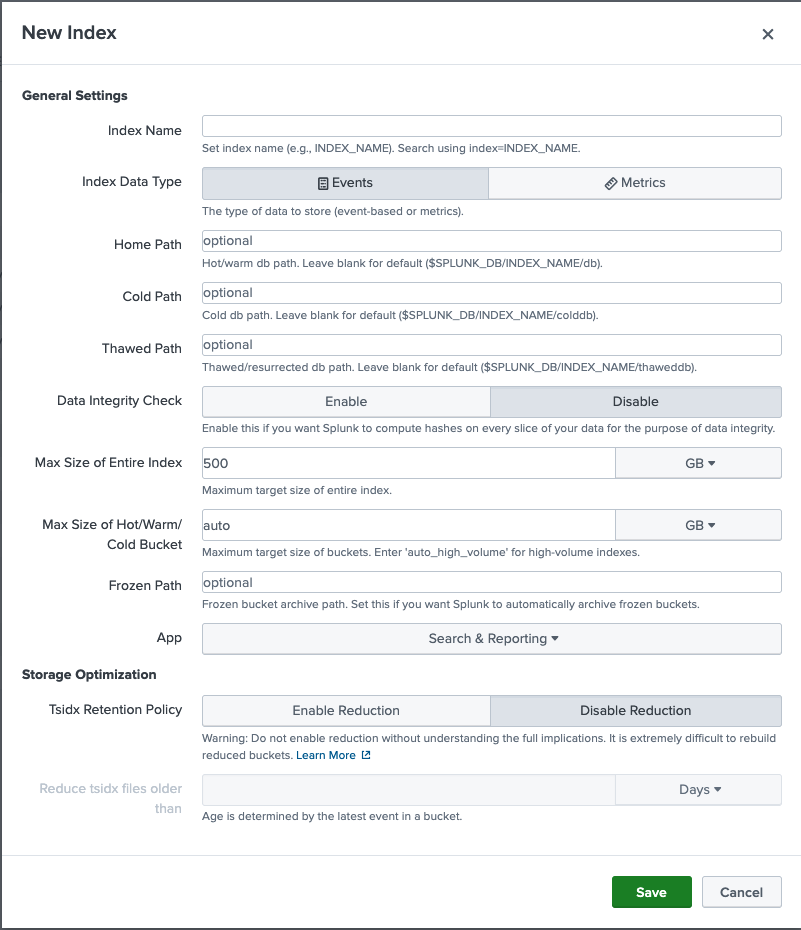
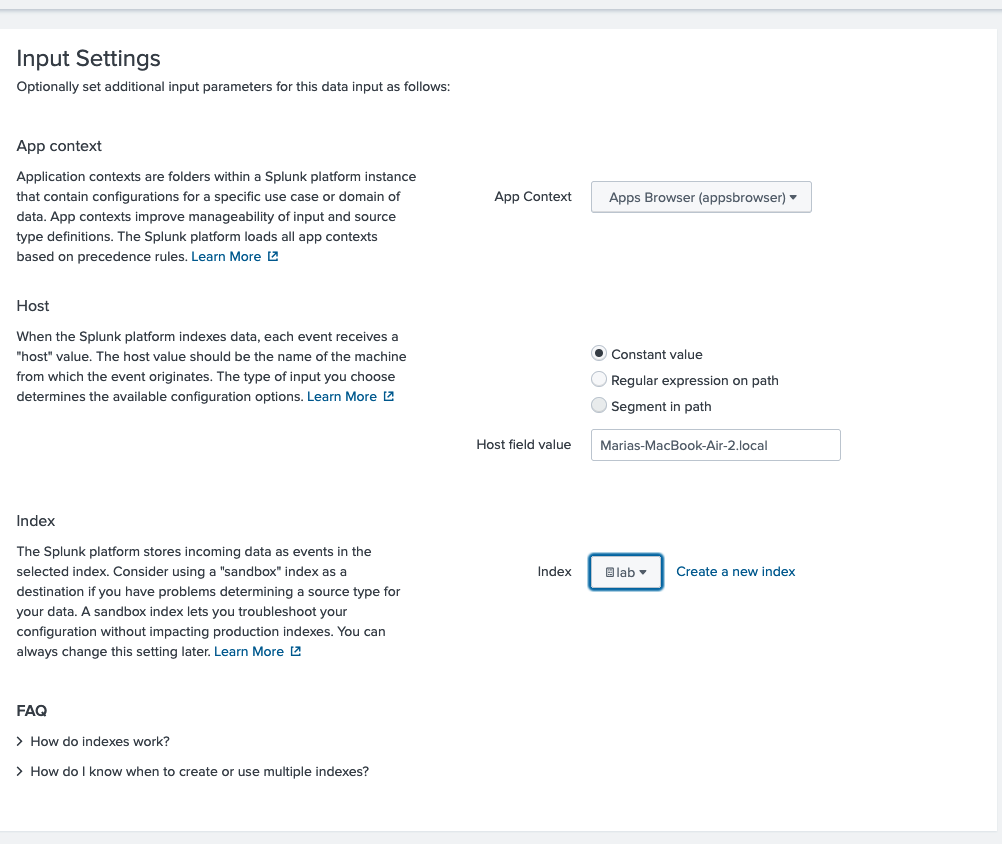
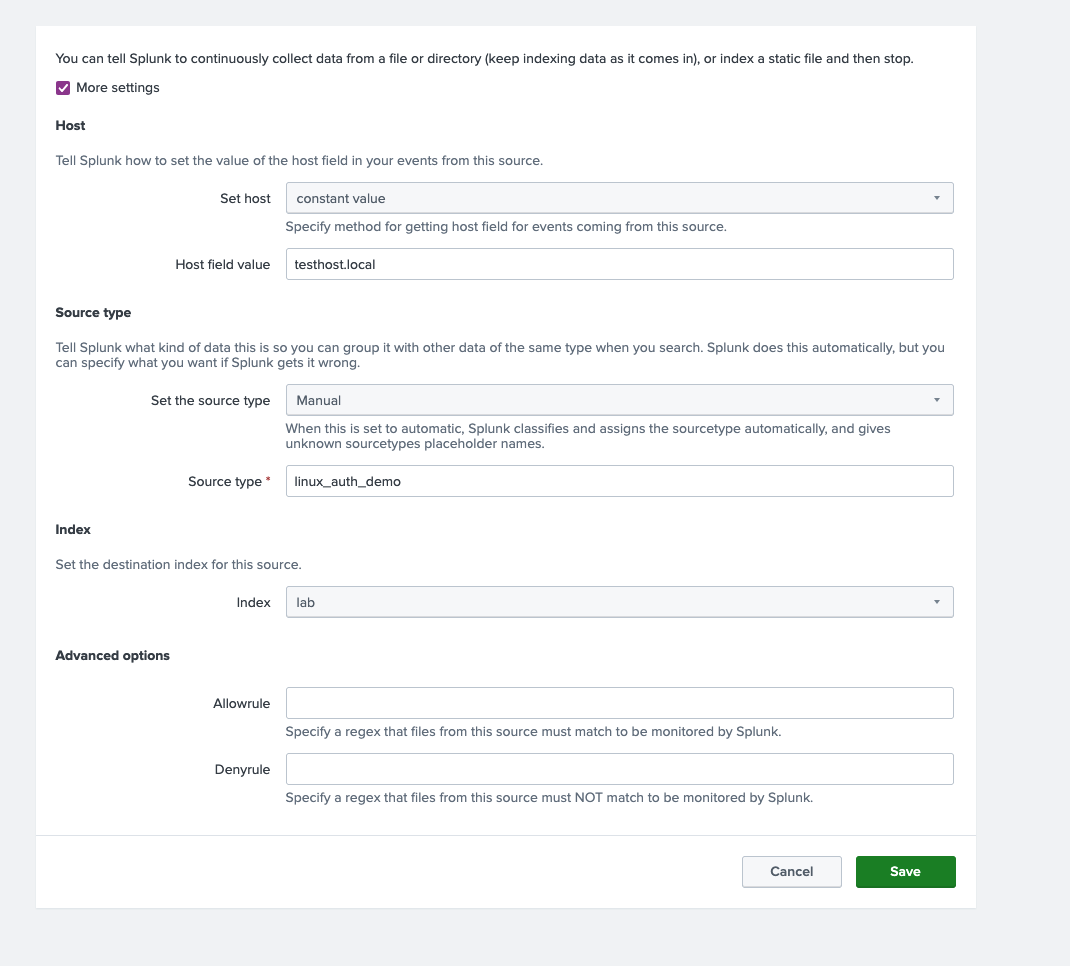
Before we can detect anything, Splunk needs the right data, so I ingested Linux authentication logs (linux_auth_demo) into a dedicated index called "lab".
I kept all test logs inside the lab index to avoid mixing them with production or default Splunk data.
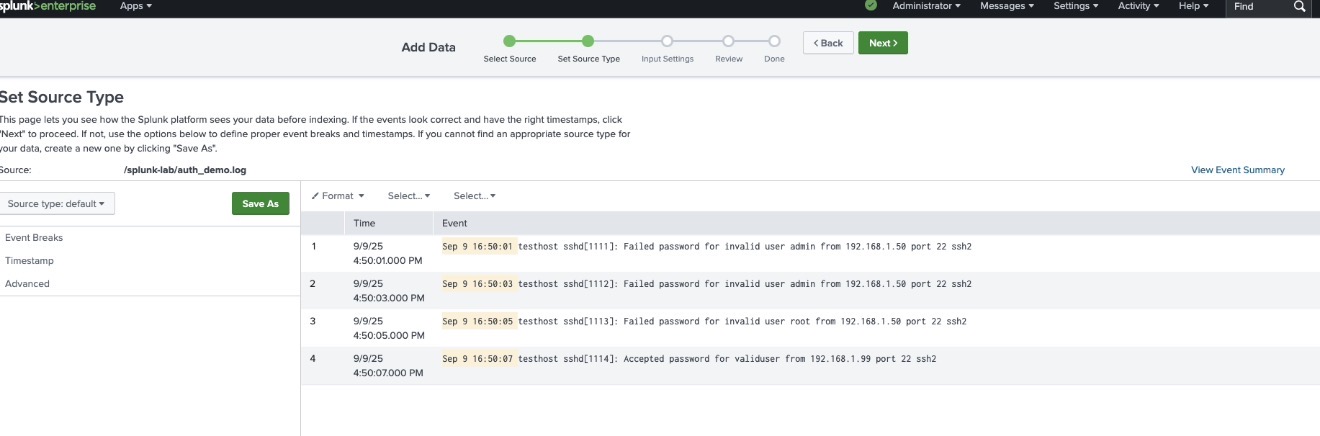
2: Search for Failed Logins
The raw logs contain both successful and failed login attempts. To isolate brute force behaviour, I searched for events with the keyword "Failed password".
This gave me individual failed login attempts, but brute force detection requires grouping them.
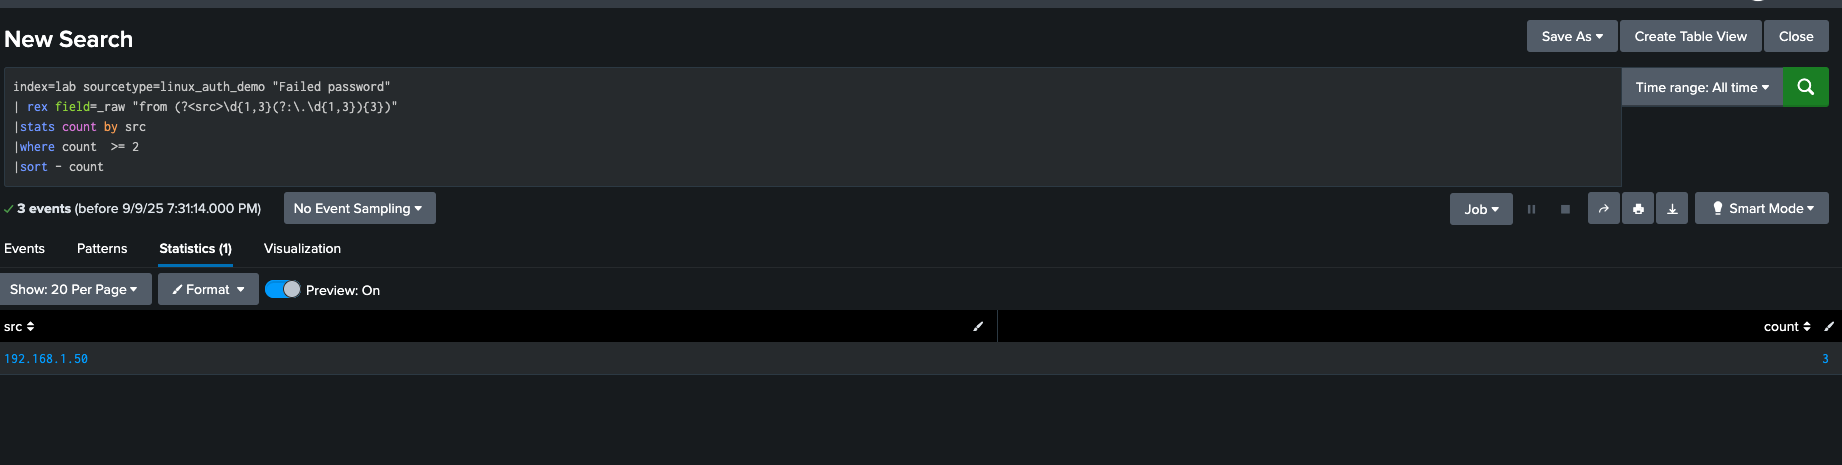
3: Identify Suspicious Spikes
Afterwards, I built a query that groups failed logins by source IP (src) and counts them over time.
This makes it easy to spot IPs generating bursts of failed logins within a short time window.
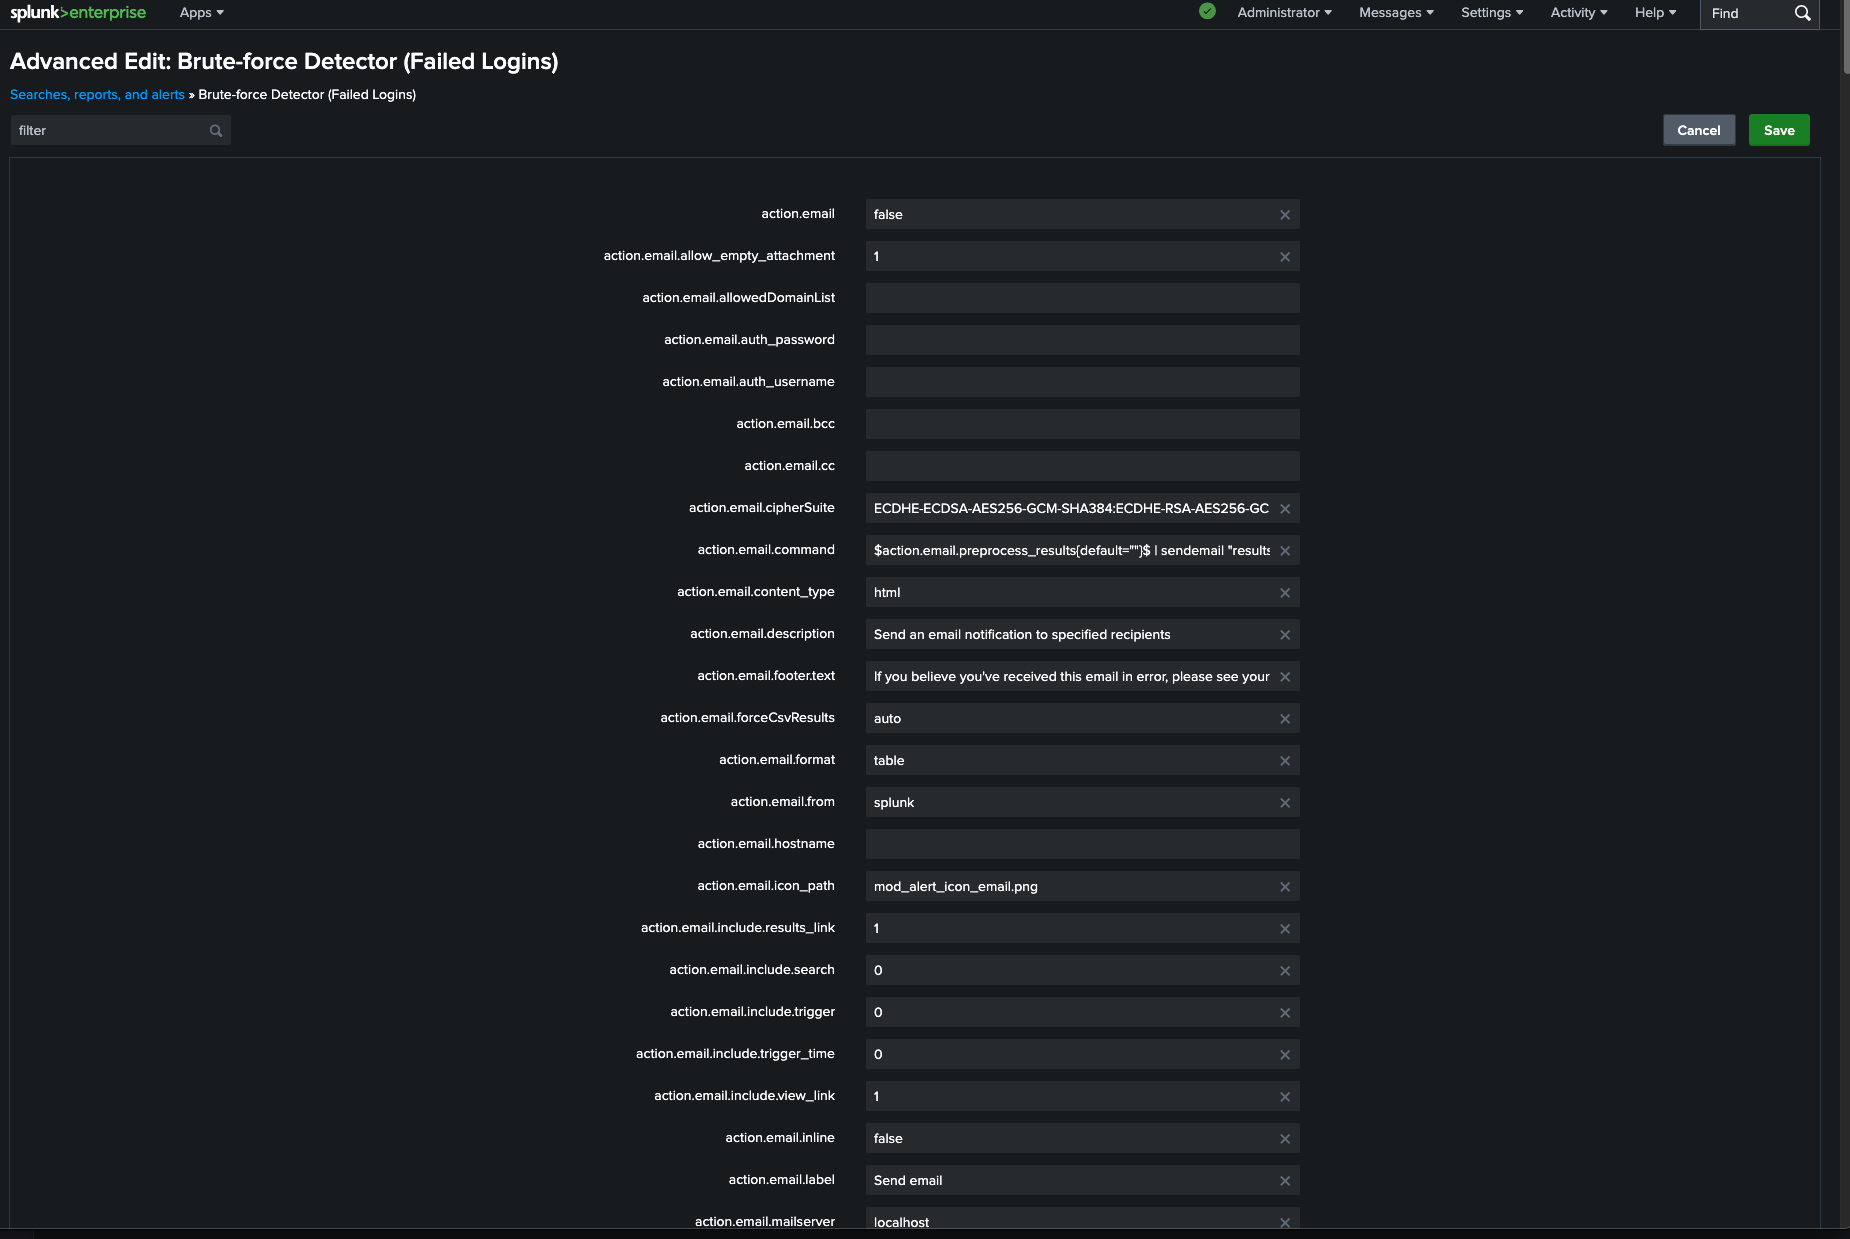
4: Create a Real-Time Alert
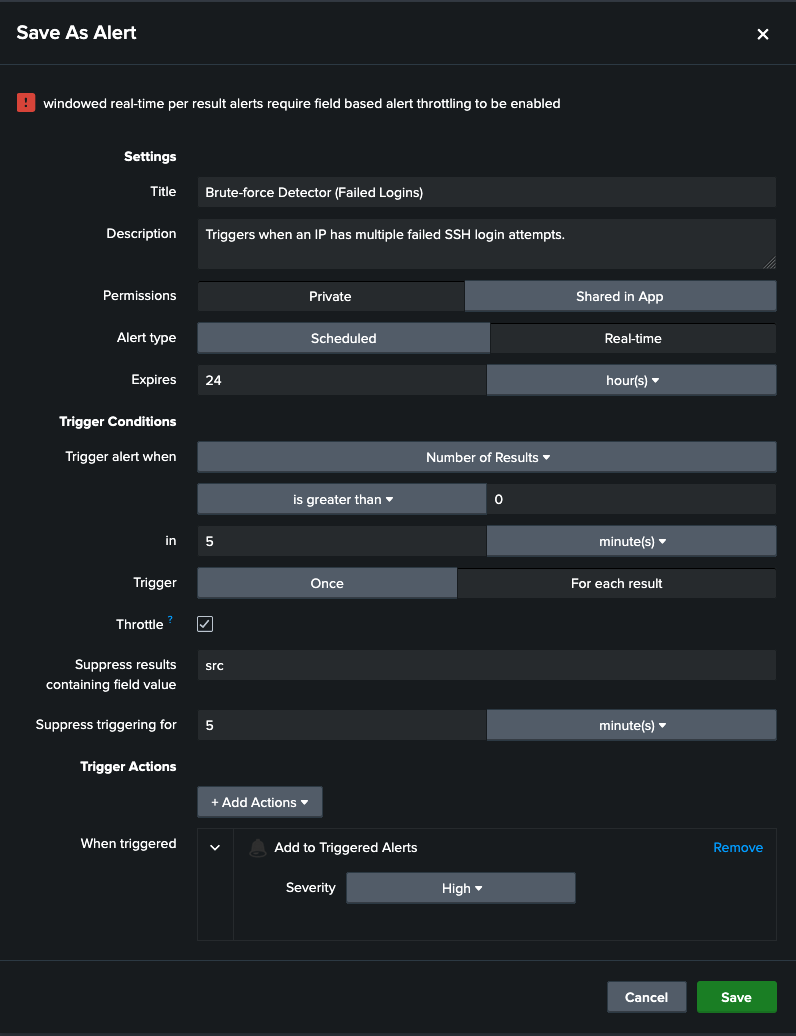
Detecting is good, but alerts are what analysts rely on, therefore I converted the search into an alert:
- Type: Real-time
- Trigger: If failed login attempts exceed a threshold (for example: 5 in 5 minutes)
- Throttle: By source IP (so we don't get spammed)
- Severity: High
This ensures analysts are notified only when brute force activity truly looks suspicious, not just from a user typing a password once by mistake.
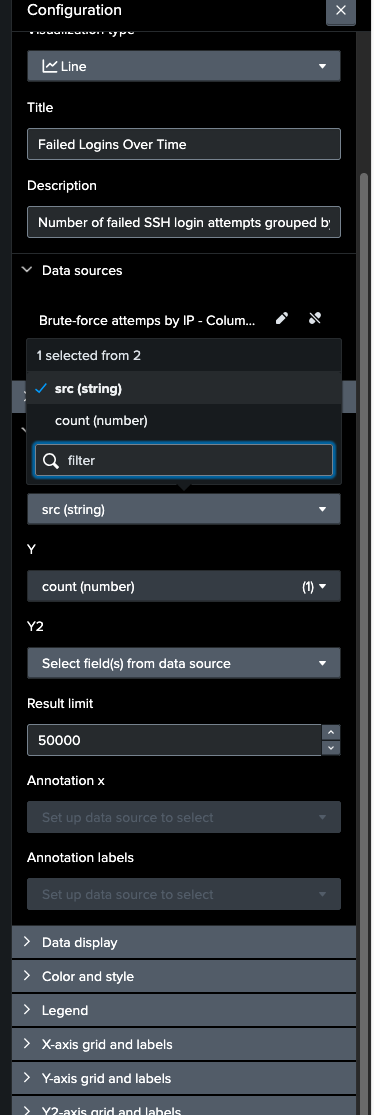
5: Build a Dashboard Panel
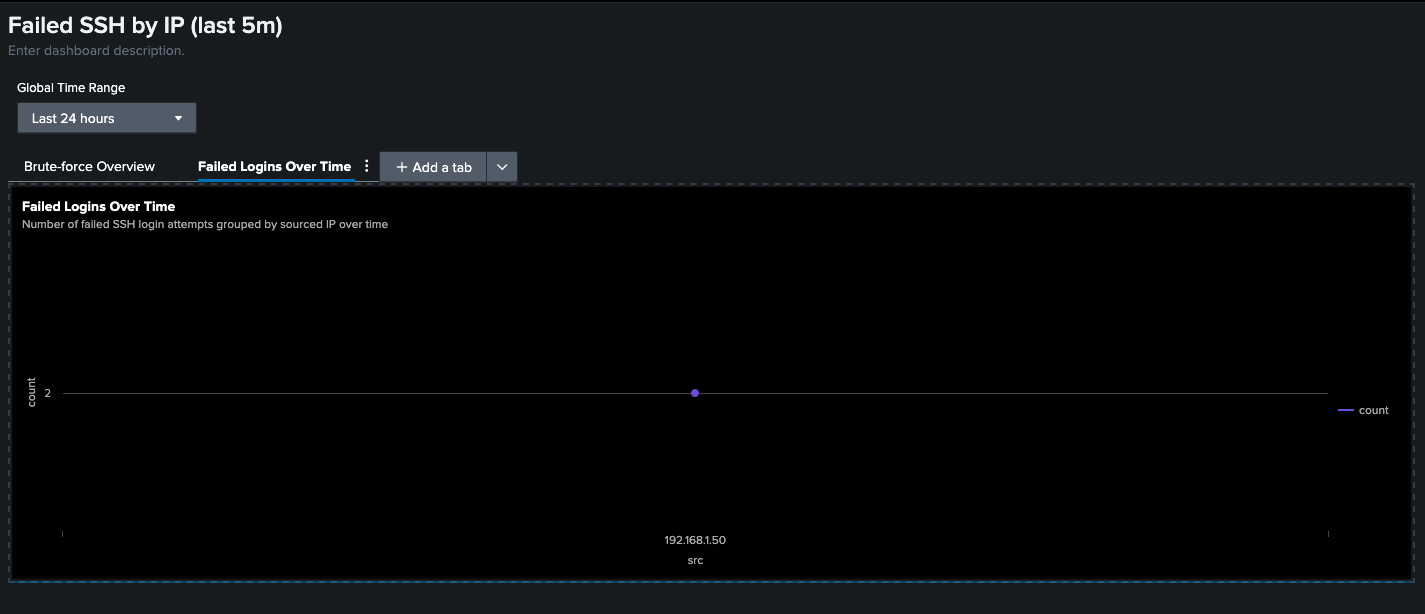
Finally, I visualized the data in a Splunk dashboard panel:
- X-axis: Time
- Y-axis: Number of failed login attempts
- Split by: Source IP
This gives a clear at-a-glance picture of which IPs are hammering the system.
6: Filter Out Noise
Not every spike is malicious, which is why I filtered out service accounts and test environments to avoid false positives and keep the focus on real brute force attempts.
Conclusion
This project gave me hands-on experience with Splunk search, alerting, and dashboarding. It has also taught me that brute force attacks are noisy; but without the right filtering, the alerts can drown analysts in false positives.
Project Screenshots
Click any image to zoom.

See the quick summary on Instagram @maria.cybersec.