Building a SOC Lab & Putting It on My iPhone Homescreen
I run a 19-service SOC detection lab on a Kali Linux machine: Elastic Stack, Suricata, Zeek, MISP, OpenCTI, Caldera, CAPE, Velociraptor, and more. At some point, I wanted to see the status of all of it from my iPhone homescreen, without opening a laptop.
At first, it seemed a simple idea, but I found 2 problems:
1: Finding Where Elasticsearch Actually Was
First step was figuring out where to connect. I ran a port check expecting Elasticsearch on its default port 9200:
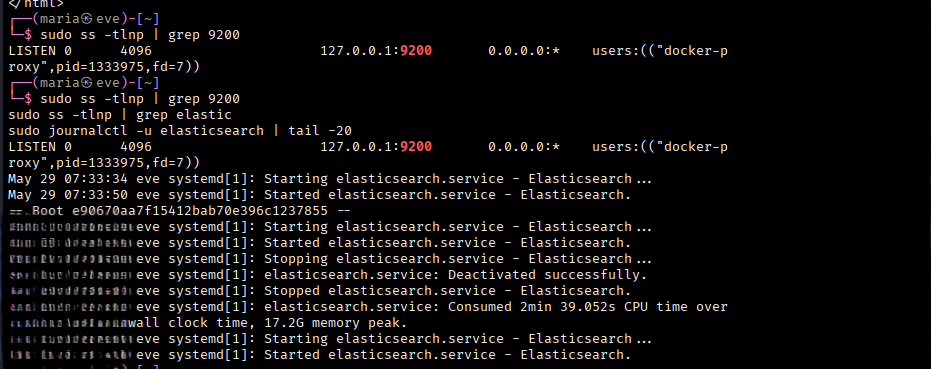
What came back wasn't Elasticsearch. It was a Docker proxy. Malcolm, my network analysis tool, had claimed port 9200 at boot before Elasticsearch finished starting. Elasticsearch had moved to 9201 without any error or warning, creating a port conflict.

Confirmed alive on 9201.
2: The Security Boundary I Had Built
With the right port found, I then tried reaching the services from my iPhone over Tailscale, but nothing responded.
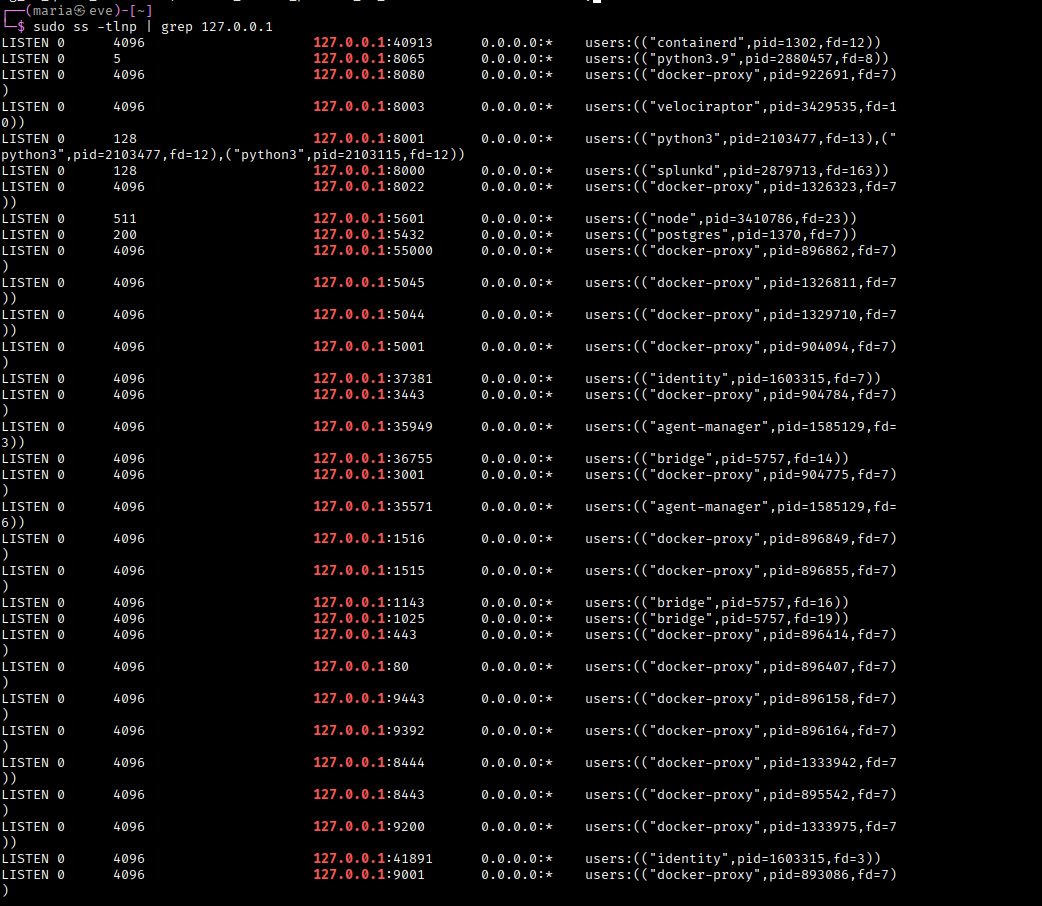
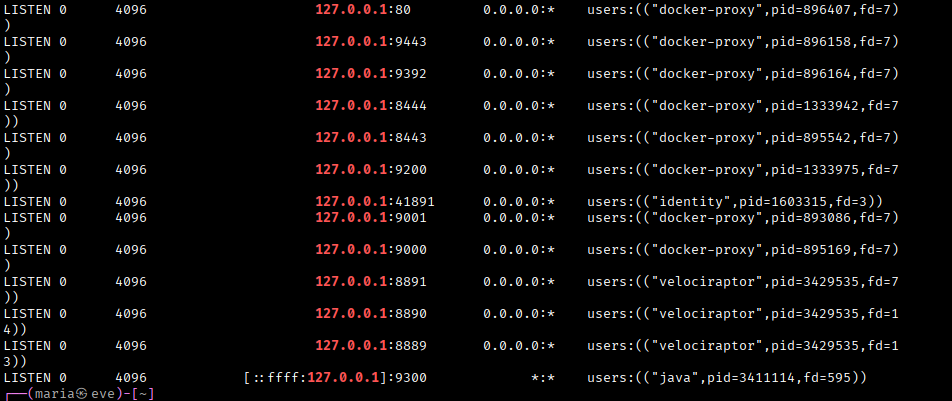
Every single service was bound to 127.0.0.1. Localhost only. Kibana, MISP, OpenCTI, TheHive, Shuffle, all of them. No external connections accepted, even over an encrypted Tailscale tunnel.
This was intentional as earlier I had hardened the lab by fixing Docker's UFW bypass and explicitly binding all services to localhost. The security was working exactly as designed, but it meant my iPhone couldn't reach any of them directly.
3: The Solution: A Status Aggregator
Instead of trying to reach each service from the iPhone, I built a middleman.
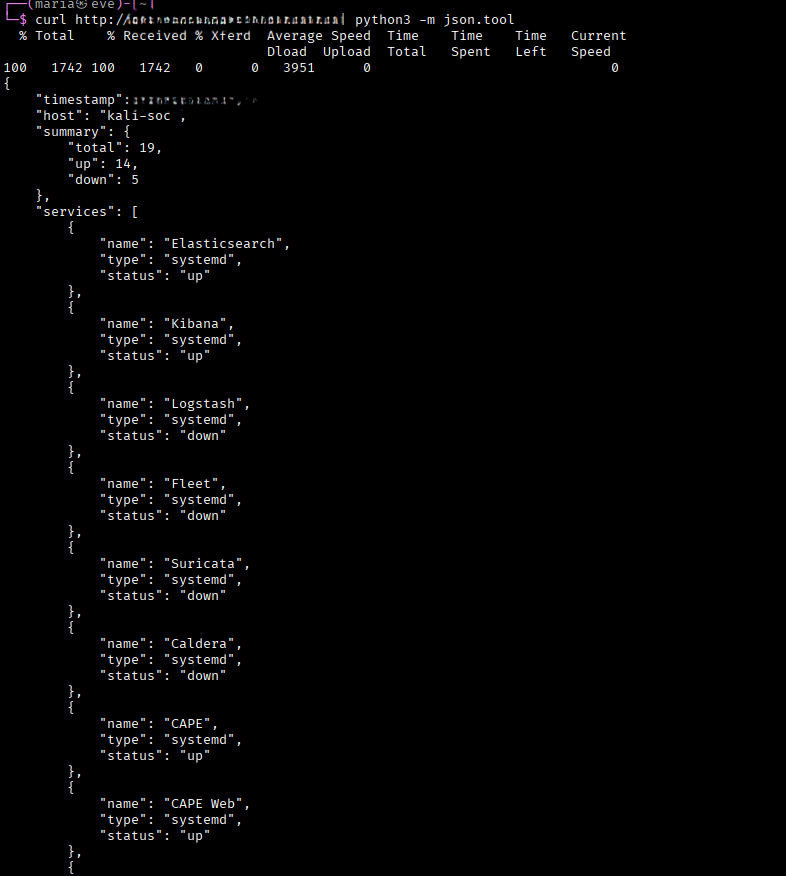
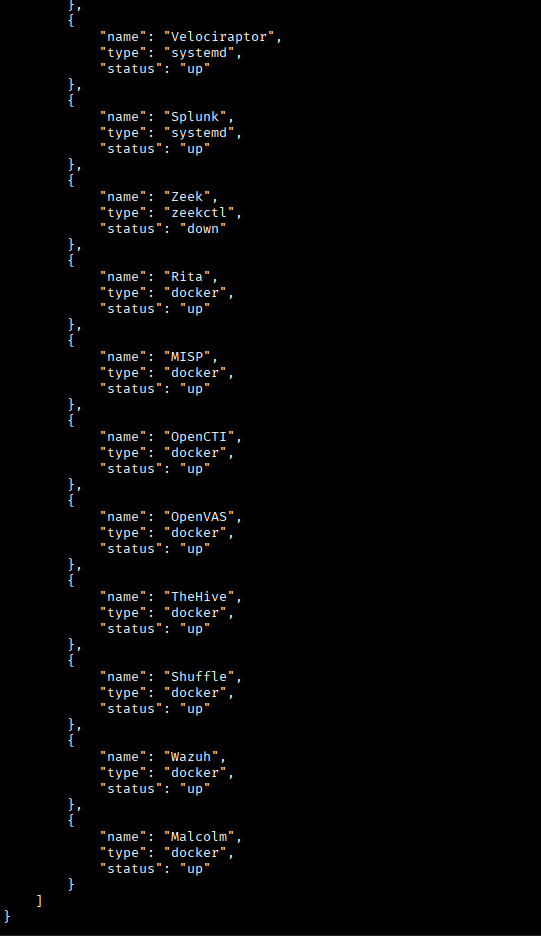
A lightweight Python HTTP server that runs on the Kali machine itself, where it can reach every service locally and checks all 19 services three ways: systemd units via systemctl is-active, Zeek via zeekctl status, and Docker containers via docker ps. It bundles everything into one JSON response and serves it on port 9777, bound to the Tailscale interface only.
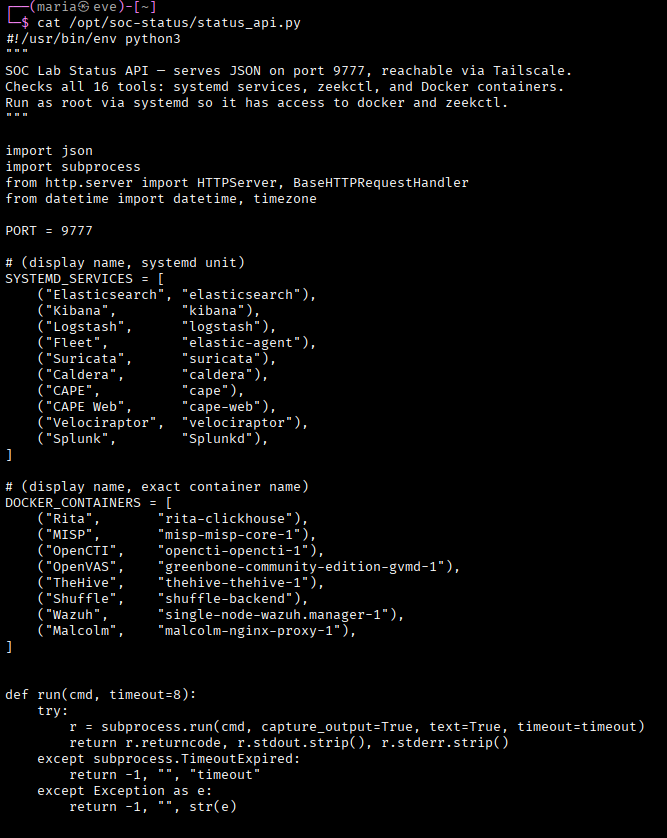
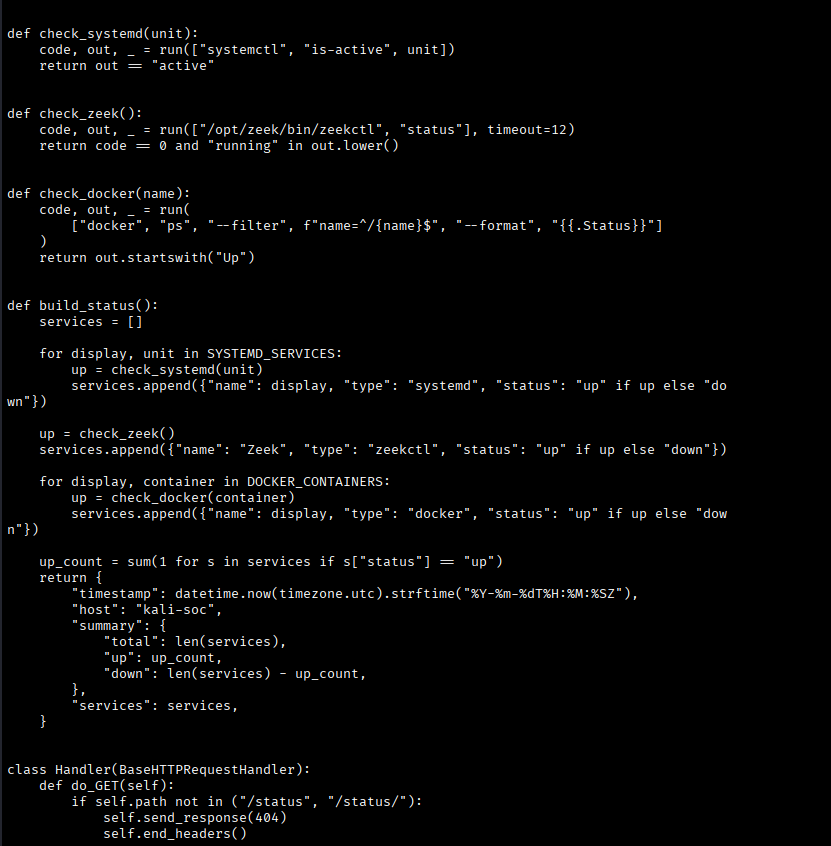
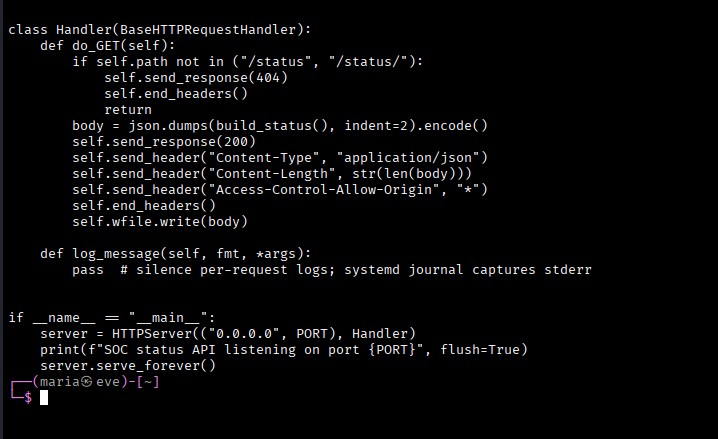
Also called a health check aggregator, where one endpoint that consolidates status from multiple isolated internal systems sits inside the security boundary and provides a single controlled point of visibility from outside it.
4: The Widget
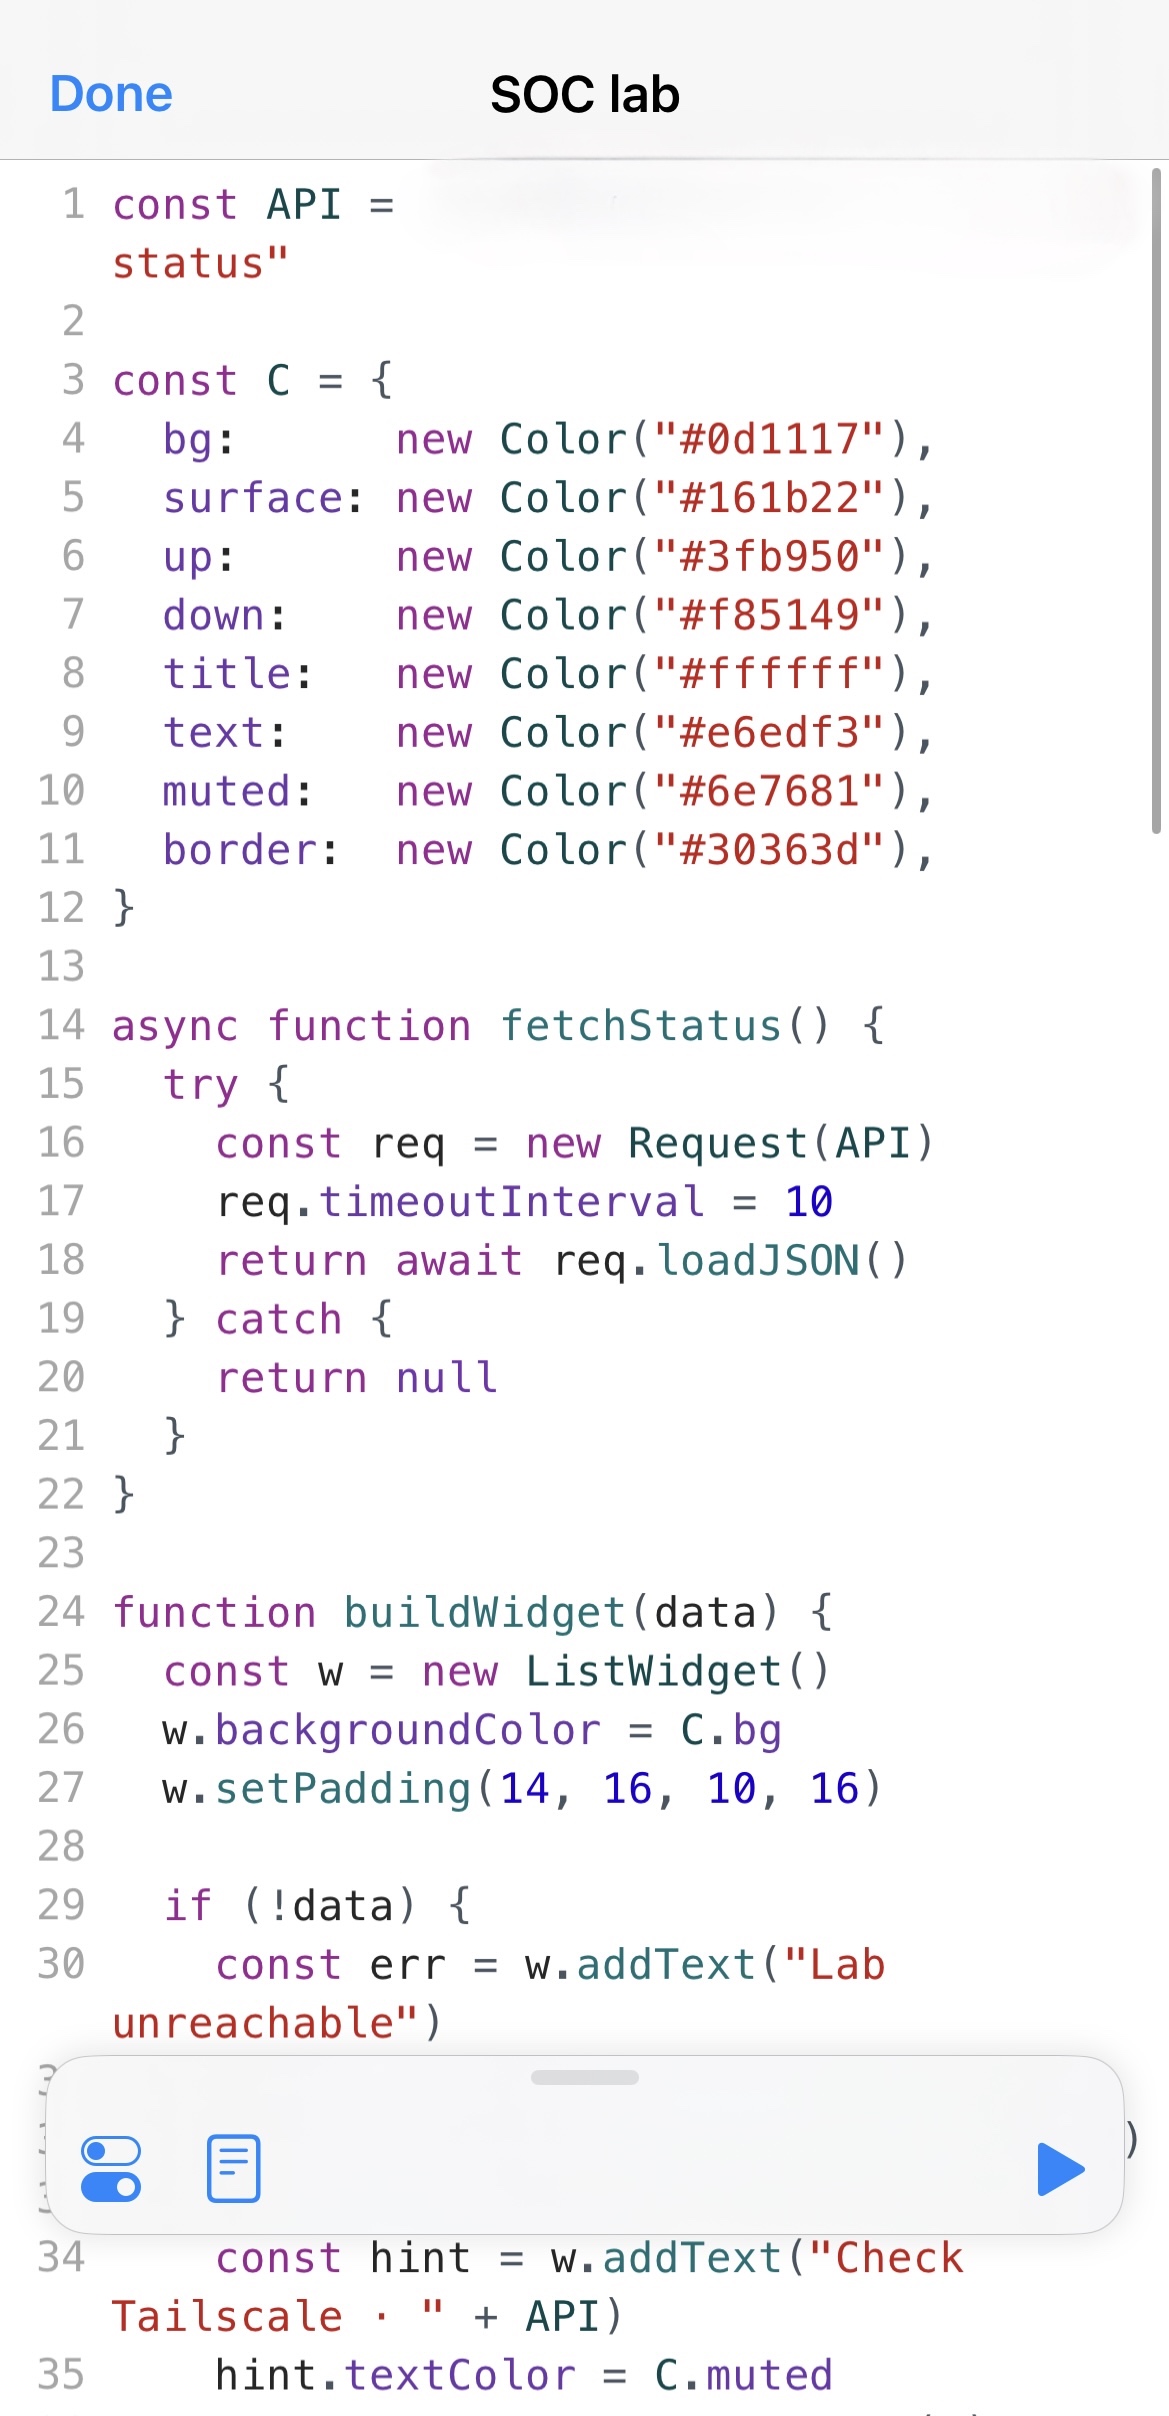
With the API running, I built a Scriptable widget in JavaScript for iOS, as it lets you write widgets that run on your homescreen and pull live data from any API.
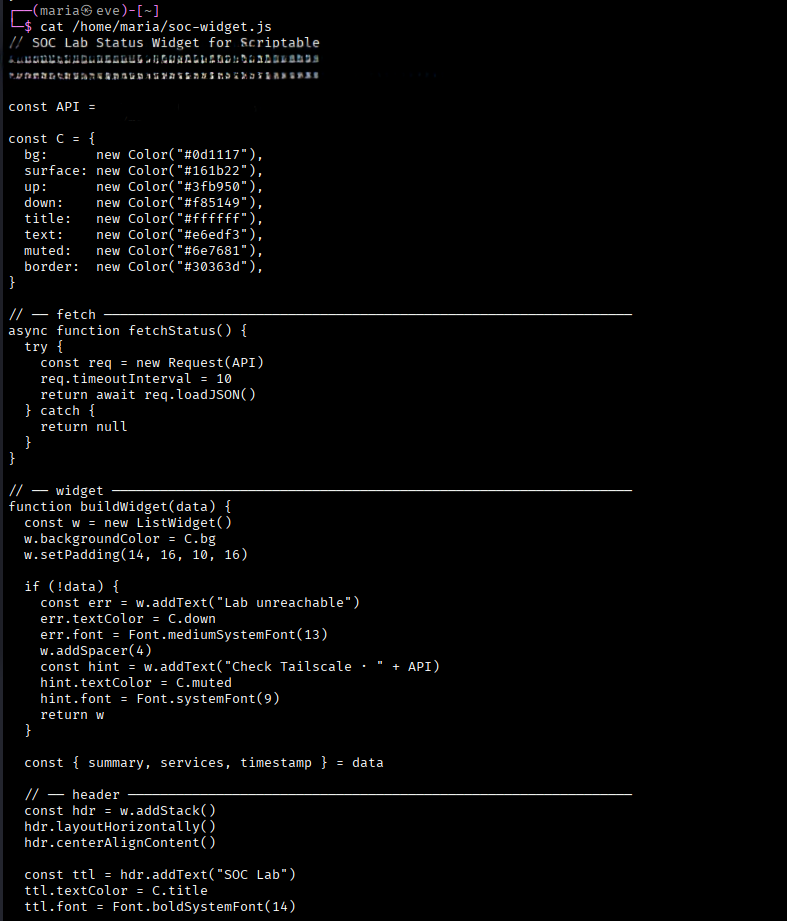
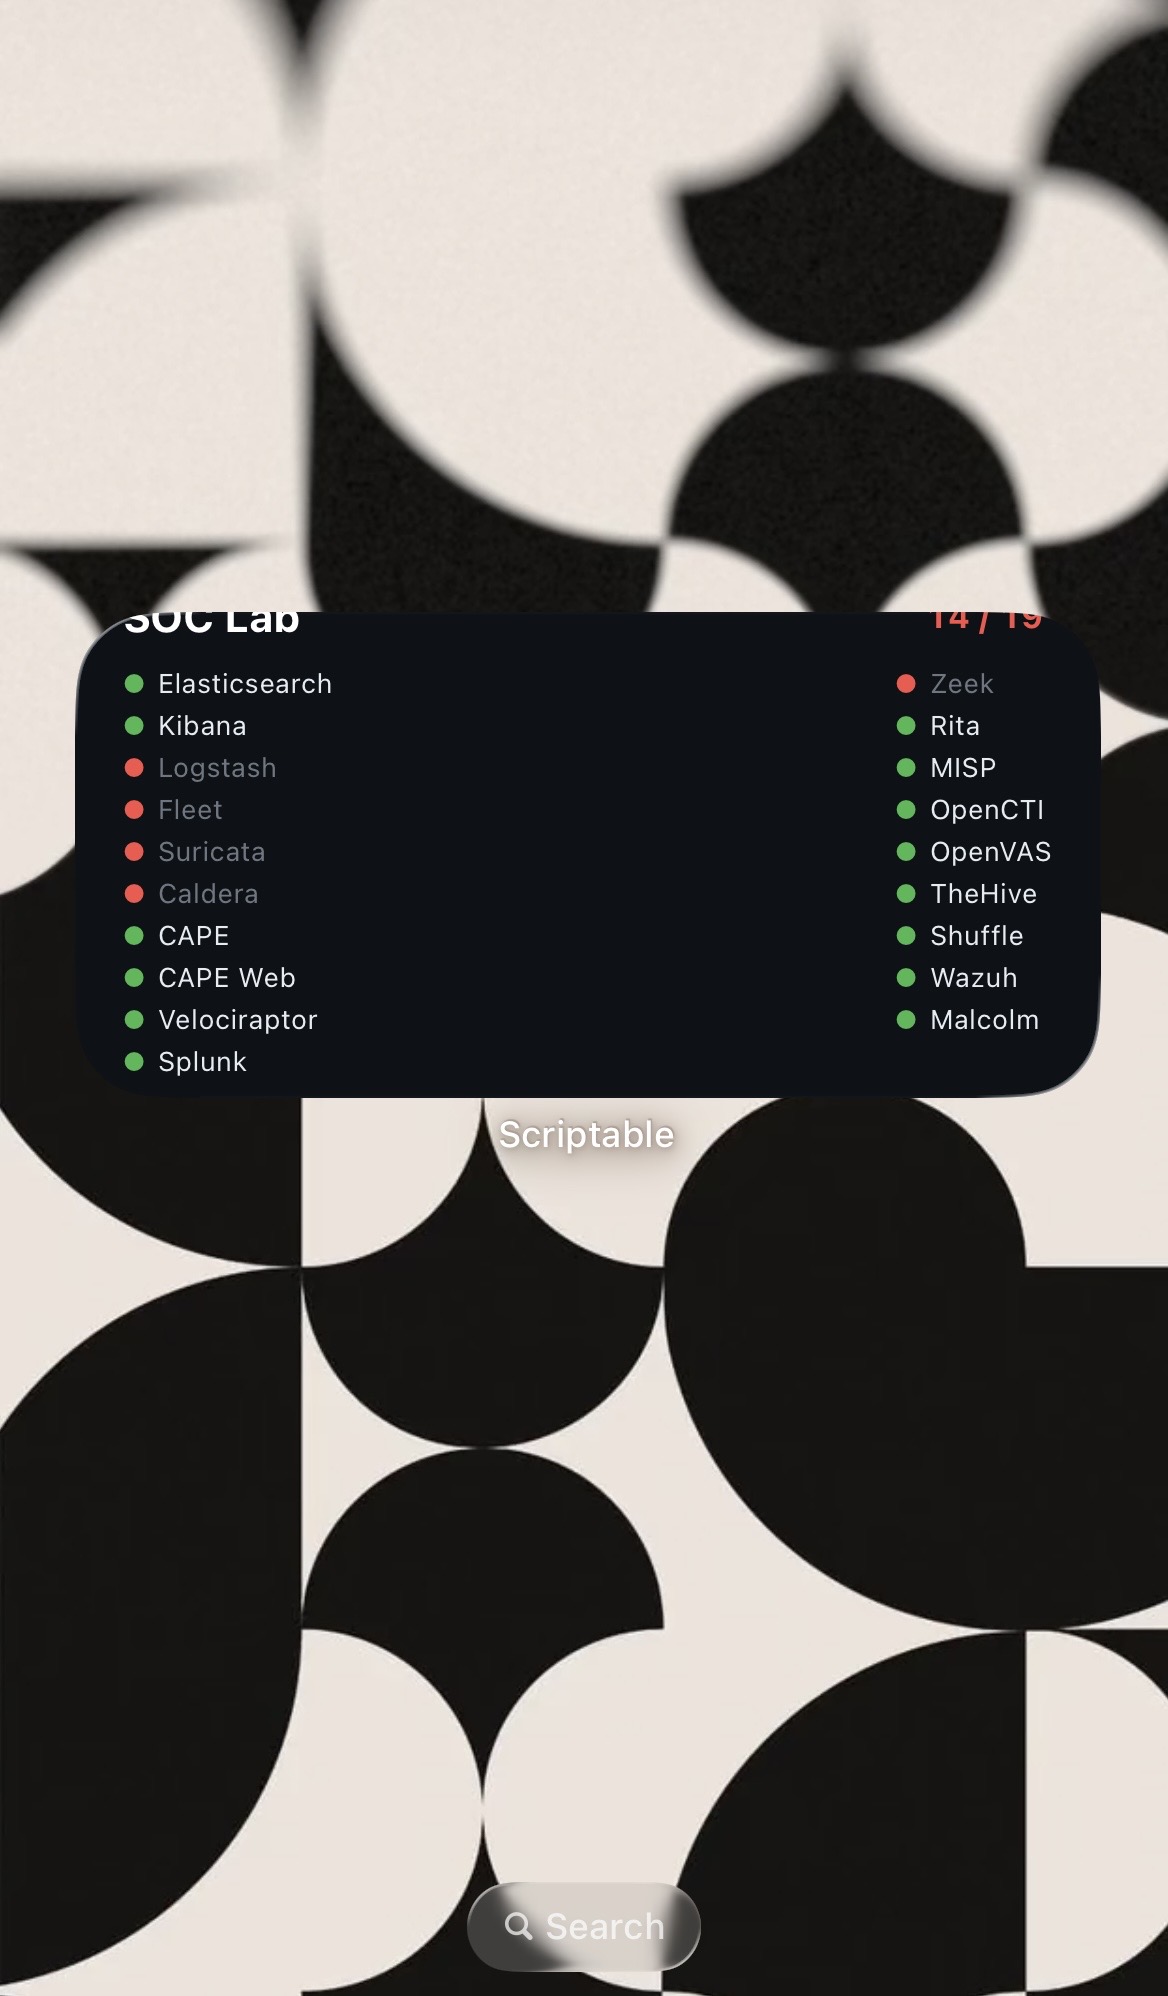
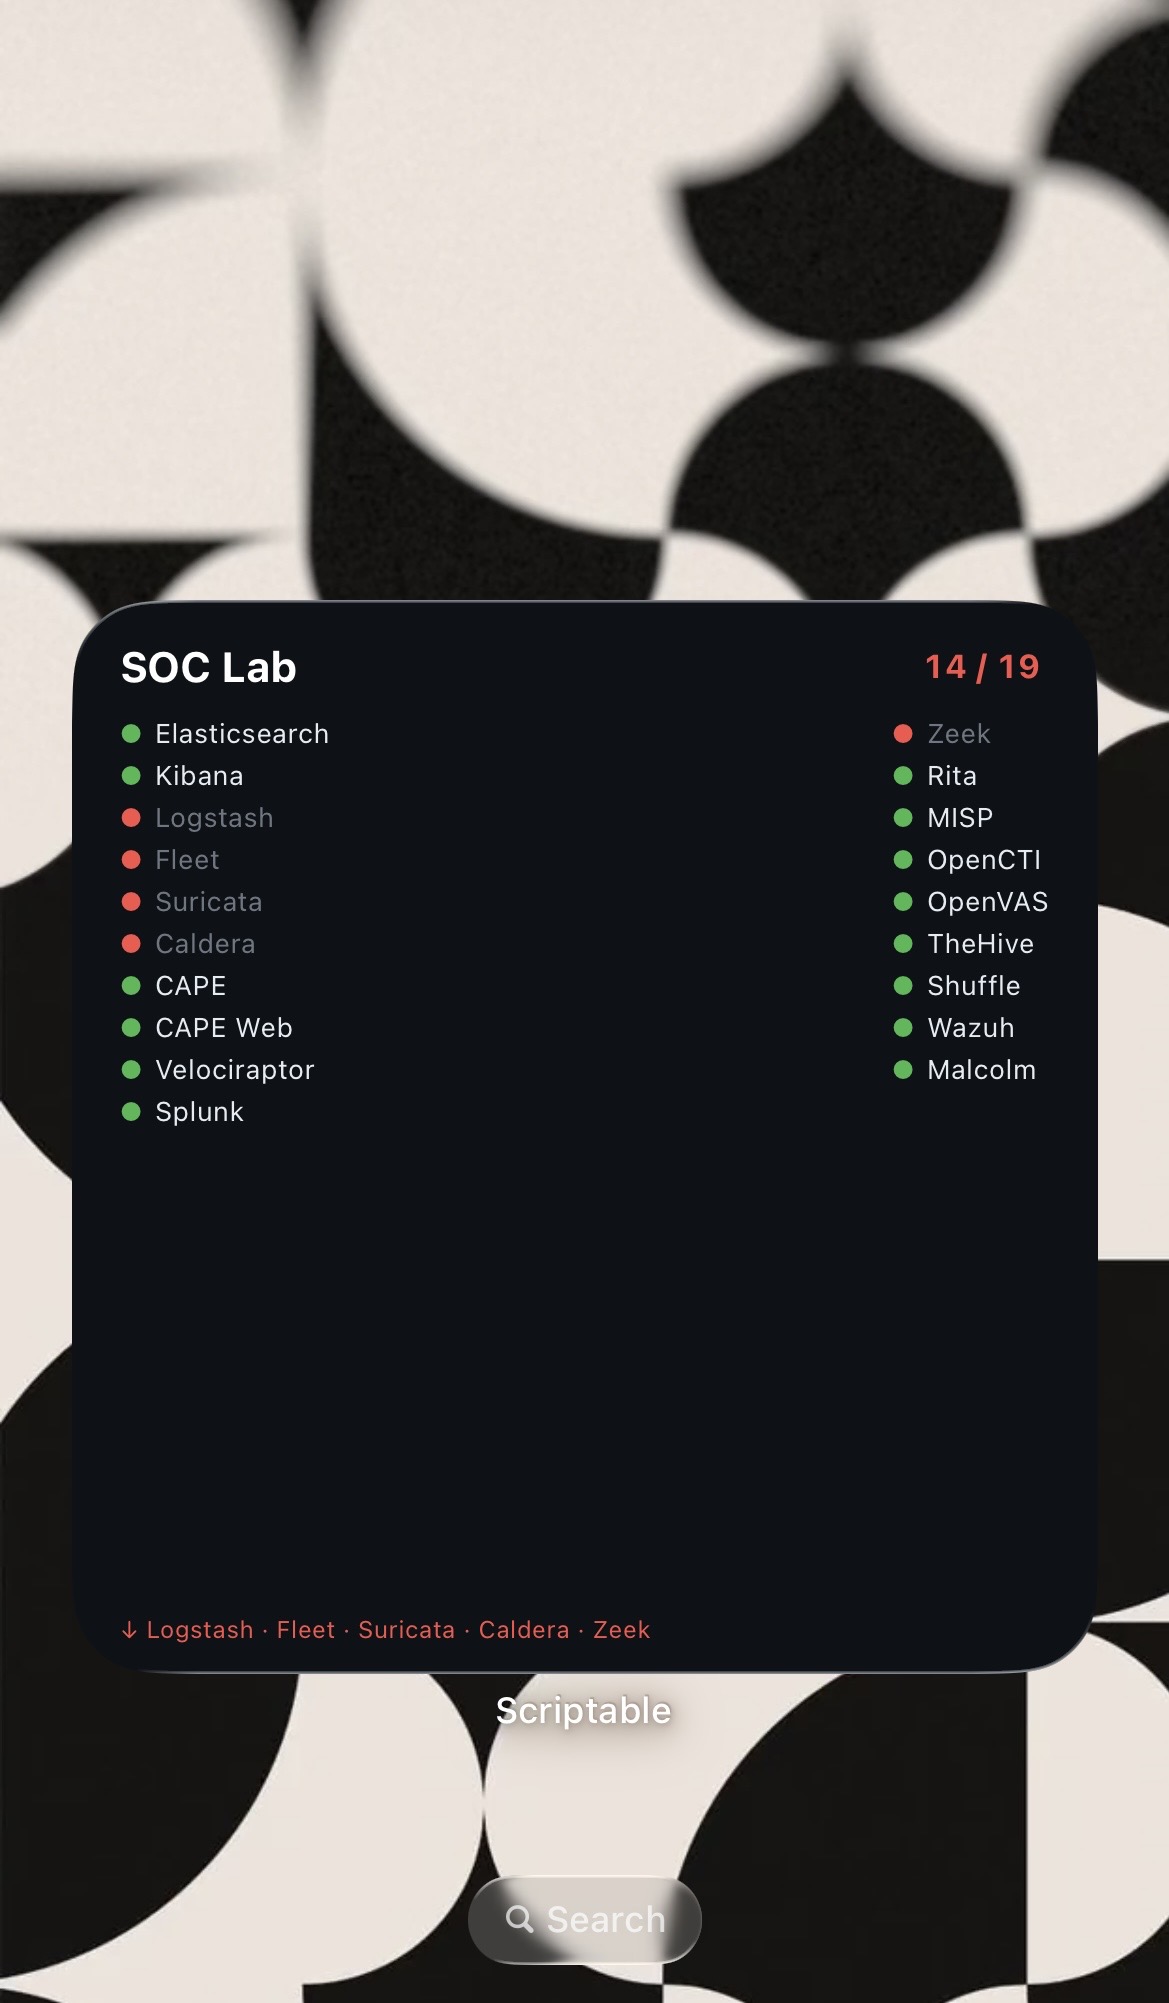
The widget makes an HTTP request to the aggregator every 5 minutes, parses the JSON, and renders each service as a green or red dot in a two-column grid. It shows as well the summary count at the top and lists any down services in the bottom. Should Tailscale be disconnected, it shows "Lab unreachable" instead of failing silently.
What I Learned
Port conflicts are silent: Elasticsearch moved to 9201 with no obvious error. Everything appeared to be running. If I hadn't investigated the actual listening ports I would have spent a long time debugging the wrong thing.
Security boundaries create visibility gaps: The same localhost binding that protected the lab from the network made it invisible from my phone, which demanded to build the right interface on top of it, not weaken the security.
The same logic applies in enterprise environments. You don't expose internal monitoring endpoints to get visibility into them but you build a controlled aggregation layer that gives you what you need without opening what you shouldn't.