Predicting Taxi-Out Time at 10 European Airports
PRC Data Challenge 2026: when the hardest part is knowing which numbers are real
Research question: can departure taxi-out time be predicted for months a model has never seen, when part of the data does not mean what it says?
The PRC Data Challenge 2026, organised by the OpenSky Network and EUROCONTROL's Performance Review Commission, asked teams to predict how long departing aircraft take from pushback to take-off at 10 major European airports: Amsterdam, Barcelona, Frankfurt, Istanbul, London Heathrow, Madrid, Munich, Paris CDG, Rome Fiumicino and Zurich.
I entered on my own, as team versatile-kitten. After more than ten years working in aviation, I know taxi time as the stretch of every flight between pushback and take-off. This was the first time I looked at it in the data.
The answer turned out to be more interesting than a prediction problem. A large part of the error did not come from taxiing at all, but from how the times were recorded.
1. The Challenge
The training data covered every movement at the 10 airports in 2025: about 4.2 million arrivals and departures, with schedules, flight-plan records, runways and stands. The target was the taxi-out time in seconds, and the score was RMSE (root mean square error), which punishes large mistakes much more than small ones.
Late in the competition, the organisers added a final phase: one single submission covering January, February, June and July 2026, ranked on Jan+Jul, Feb+Jun and all four months. February and June had no leaderboard feedback at all.
That shaped everything. The validation used the same four months of 2025 as a hold-out, so winter de-icing and summer peaks were tested the way they would be in the final.
2. Taxi Times That Are Not Taxi Times
The first baseline was an average per airport and hour: 654.99 s on the live leaderboard. A gradient-boosted model brought it to 432.98 s. Then the errors pointed somewhere unexpected.
At Rome Fiumicino, 82.9% of departures with a taxi time over one hour reported a taxi time equal to the scheduled delay. The aircraft had not taxied for hours. The off-block time had been recorded as the scheduled time, so the "taxi time" included the whole delay.
A model trained on those rows learns that taxi times can be hours long, and gets worse on normal flights. So the model became a mixture:
- a classifier estimates how likely it is that a flight's reported time is such a reporting artefact
- a regressor predicts the normal taxi time
- the prediction is the expected value of the two cases
That one change took the four-month hold-out from 448.74 s to 395.09 s, and the live score to 384.90 s.
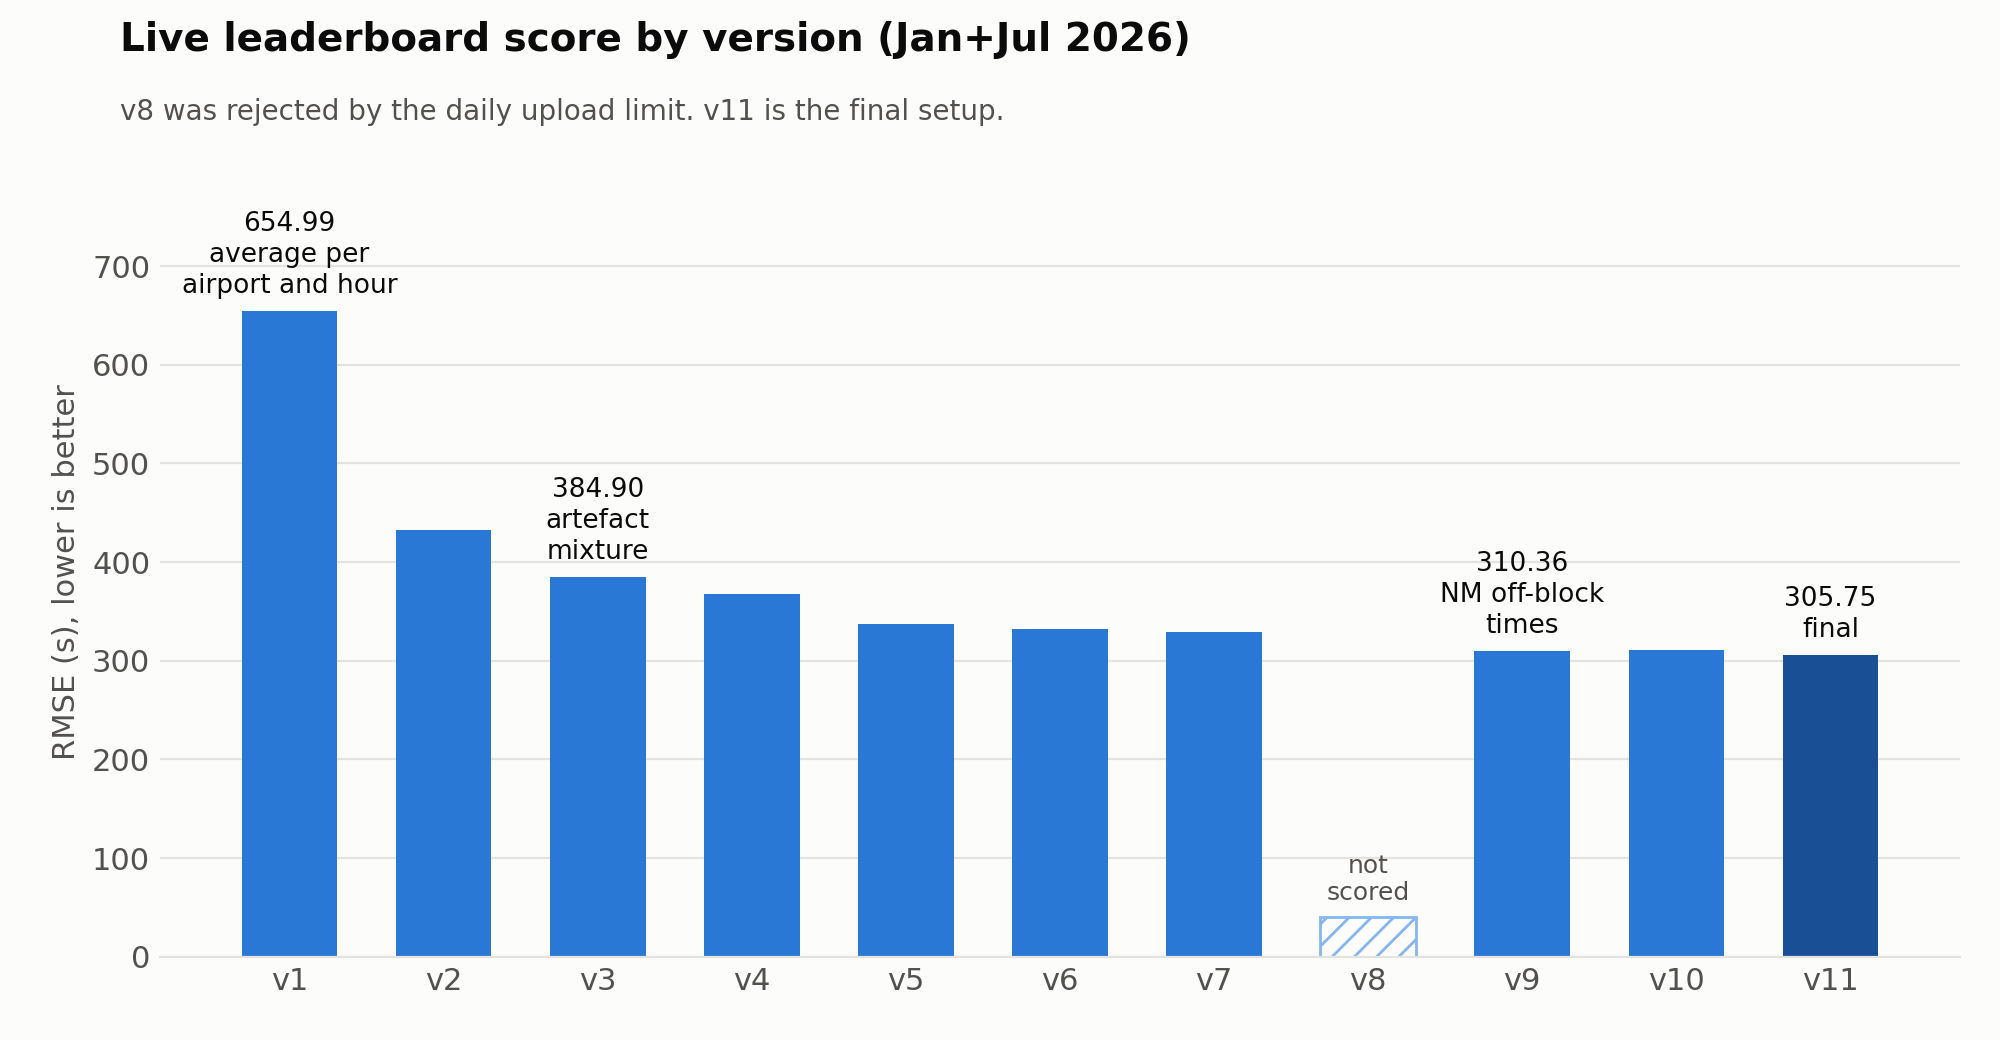 Live leaderboard score by version
3. Flights That Taxied for a Day
Sixteen 2025 departures had a taxi time over 80,000 s, more than 22 hours. Twelve of the fourteen that were not schedule artefacts were at Rome, and for every one of them the taxi time minus exactly one day was an ordinary 13 to 33 minute taxi.
The pattern only made sense once I looked at the clock: the flight was scheduled on one day and pushed back after midnight, and the off-block time was stored with the scheduled date. The data confirmed it:
| Day errors | |
|---|---|
| Rome departures that cross local midnight (scheduled one day, take-off the next) | all 12 |
| Rome departures that do not cross midnight (about 160,000) | 0 |
Eleven cases are too few to learn from, so instead of a model I used a rule: in the risk group (Rome, no flight-plan record, delay over 4 hours, take-off after local midnight), 11 of 63 flights in 2025 were day errors, and the prediction is weighted by that measured rate.
4. Deciding Without Fooling Myself
With RMSE, a handful of rows can decide everything. In the hold-out, 10 rows with taxi times over 80,000 s dominated the variance of the whole score. The live leaderboard had the same problem: a single day-long taxi time can move a score by several seconds.
So I fixed a rule before looking at any result:
A change is kept only if the score on the other rows ("clean" rows) is clearly better across all four months, with a bootstrap 95% interval entirely below zero, and neither month pair gets clearly worse.
The live leaderboard became a sanity check only. That was tested quickly: one version scored 0.46 s worse live than the one before, although it was clearly better on the validation. It stayed.
5. What Moved the Score
| Step | Clean RMSE (s) | Change |
|---|---|---|
| Mixture model, linear trees | 315.39 | |
| + day-error rule | 307.69 | -7.70 |
| + weather (METAR) | 302.83 | -4.86 |
| + learning rate 0.025 | 301.43 | -1.39 |
| + NM off-block times (confirmed allowed by the organisers) | 285.05 | -16.38 |
| + second and third regressors (LightGBM and CatBoost) | 281.03 | -4.02 |
| + midnight day-error group, CatBoost classifier averaged in (3 seeds) | 276.60 | |
| + taxi level of other departures, cost-weighted classifier (final) | 270.92 | -5.68 |
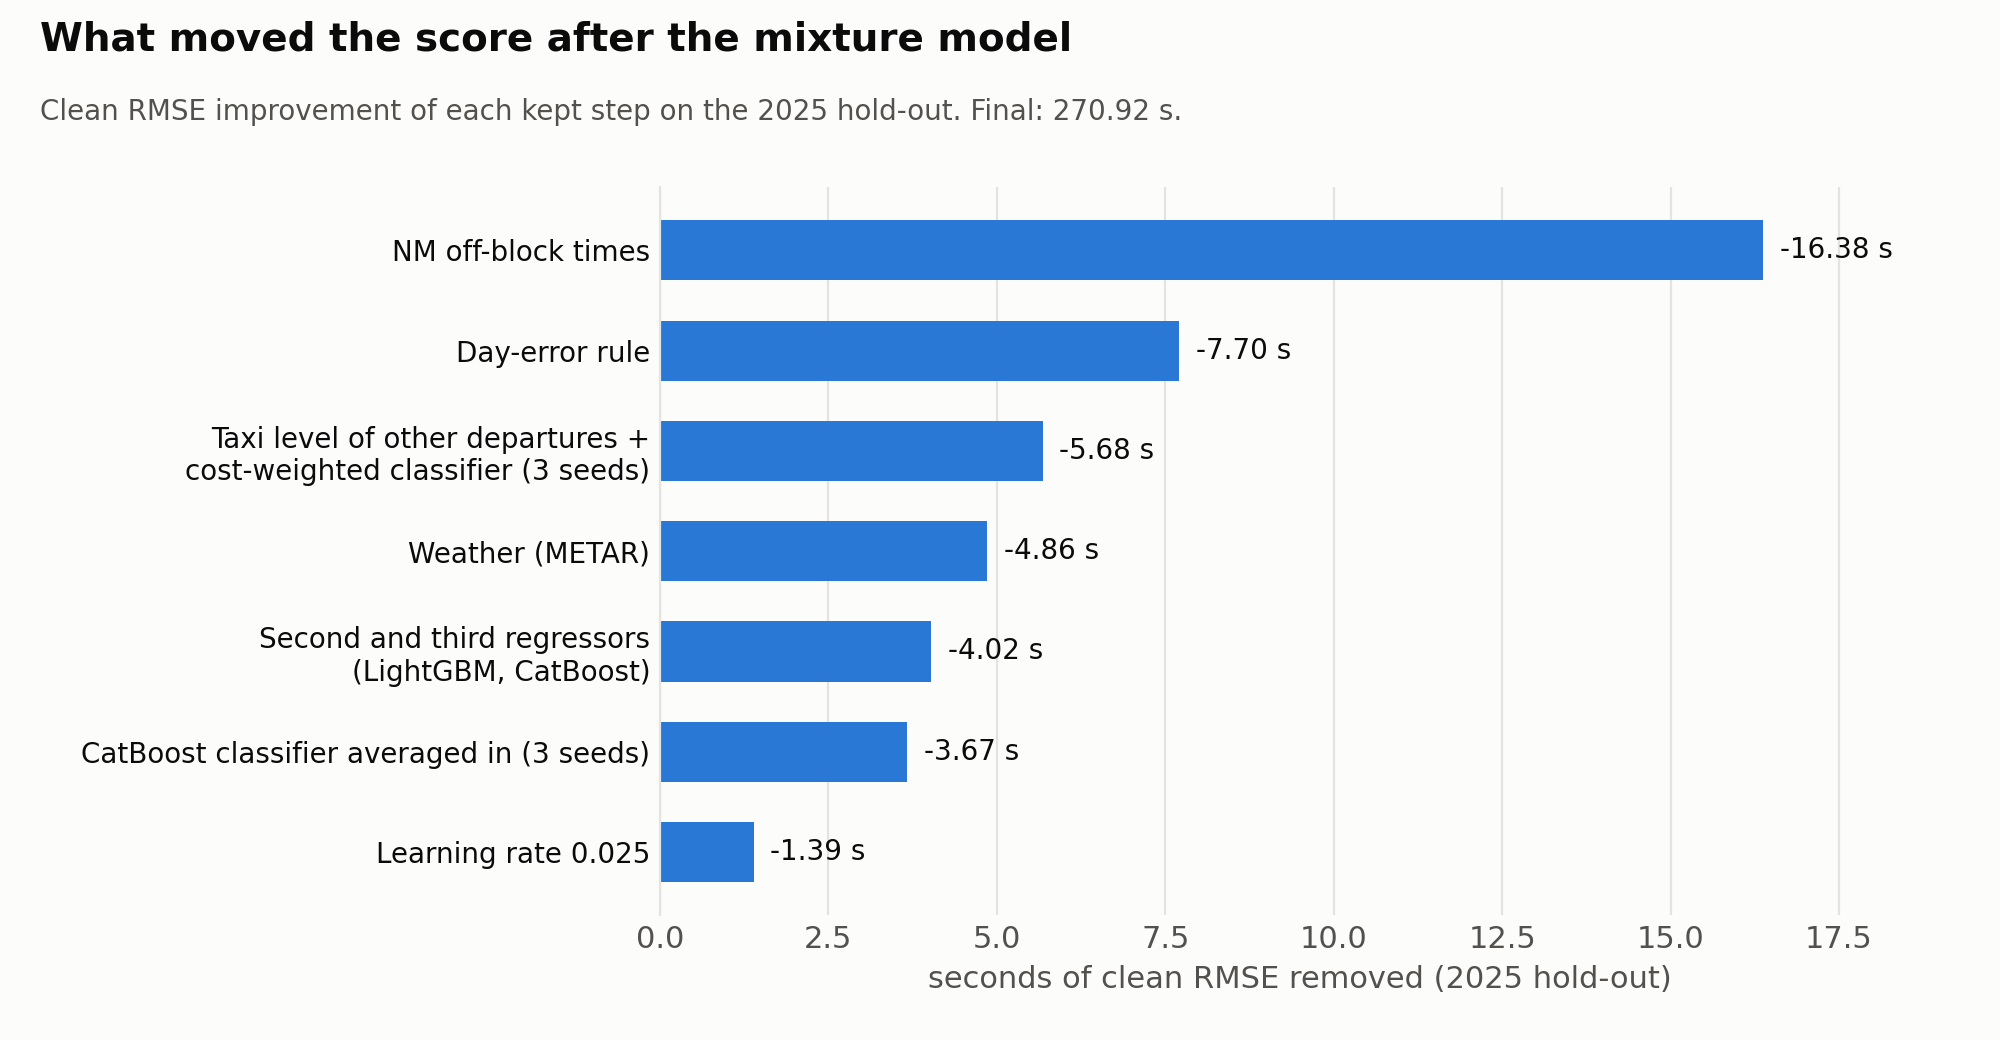 What moved the score after the mixture model
Weather helped exactly where it should: Munich -24.3 s, Paris CDG -15.0 s and Amsterdam -9.3 s, the airports with the most de-icing.
Two ideas in the final step are worth explaining. The first gives the model the current taxi level of the other departures around each flight, so it can tell when the airport is congested. The second came from a mismatch: a classifier can get better at ranking flights on average and still get worse on RMSE, because a wrong call on a flight delayed by three hours costs far more than one on a flight delayed by twenty minutes. Training the classifier with weights that reflect that cost improved the score although its AUC hardly moved.
Final result: clean RMSE 270.92 s on the 2025 validation (330.13 s on all rows), and 305.75 s on the live leaderboard.
6. What Did Not Work
Most ideas did not survive the rule, and they are all documented in the repository. A few of them taught me something:
- Wider artefact windows. Many Rome taxi times were close to the scheduled delay but not exact. Labelling them as artefacts made the score worse: the classifier could not tell which flights they were.
- A separate model for Rome. Rome has the largest error, so a dedicated model seemed obvious. It was worse: the shared model learns from the other airports.
- The airline behind each callsign. Some reporting faults really do cluster by operator. But the model had already learned it, and the measured gain was zero.
- A local time stored as UTC. Some Rome flights report a taxi time of exactly one hour (winter) or two hours (summer) plus a normal taxi: Rome's offset from UTC. A real pattern, but worth about 0.2 s, so it stayed a finding, not a rule.
7. Reproducibility
The final step was to prove the submission can be rebuilt from the public code alone. In a fresh folder, with only the repository files, a new environment and the raw data, the whole pipeline ran again for about 9.4 hours and produced a final file byte-identical to the one I submitted.
Conclusion
The biggest gains in this project did not come from tuning models. They came from understanding how the times were recorded: schedule copies, dates that slipped past midnight, local times stored as UTC.
This is the same lesson I keep meeting in security work. Before trusting a signal, understand how the data behind it is produced.
A model can be accurate on paper and still be learning the wrong thing, if the data does not mean what it says.
The final rankings will be announced by the organisers, and I will update this post with the result.
What I Learned
- Understand the data before tuning anything. The mixture model and the day-error rule did more than any parameter change.
- One metric can be dominated by a handful of rows. Ten rows out of 671,293 decided the variance of the whole score.
- Write the decision rule before seeing the result. It is the only way to stop chasing noise, especially with a live leaderboard.
- A better AUC is not the same as a better score. What a mistake costs matters as much as how often it happens.
Data: PRC Data Challenge 2026 data, provided by the organisers (not redistributed). Weather: METAR reports from the Iowa Environmental Mesonet, Iowa State University (public domain).
Code and full experiment log: GitHub repository